

When people hear the word “analytics,” they tend to get nervous—especially when it’s coupled with other words like “algorithm,” “GPU,” and “deep learning.” And they automatically think that the subject matter is beyond their understanding (or even their IT team’s abilities).
However, analytics doesn’t have to be impossible or “beyond your current capabilities.” Your company is currently operating off of ineffective analytical protocols and tools; you need to establish a more robust solution for the future.
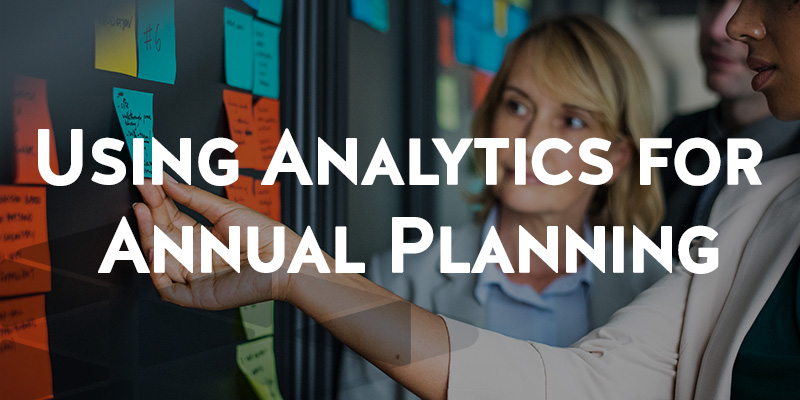
Here’s how to leverage analytics the right way for the new year.
Run an Analytics Maturity Assessment on Your Current Systems
Even the smaller side of the SMB world generates a great deal of data; you just may not know how to use it.
With that generated data, you ultimately need to be able to intelligently answer the questions:
- What did we do last year?
- How did we do it?
- What do we need to change to do better?
Of course, you have answers for those questions right now, but they are probably answers that are extremely limited in scope and detail.
For example, you may already be going to your QuickBooks to generate Excel reports on past business years. You then run macros and formulas against them to determine what and how you did from quarter-to-quarter from 2017 to 2018. While this level of comparison will marginally help you make better decisions for the coming fiscal year, performing data analytics manually is grossly under-utilizing the data you have at your disposal.
You aren’t even tying this data into your sales orders. Or keeping track of how many transactions you did each year. At this point, you have only built a General Ledger and an Income Statement.
Raw numbers won’t get you very far.
You Can’t Do This on Your Own Steam
But those same raw numbers—when plugged into an effective analytics maturity assessment and visualization platform—can reveal myriad more insights than you are capable of discovering and applying manually.
High-quality analytics platforms provide an intuitive dashboard that not only mines historical records for current and future trend data, it also stays connected with current data sources to make real-time business, security, and network-related determinations.
No longer do you need your Database Manager to (slowly and ineffectively) pull the data you need, and neither do you need to be a Data Scientist to make sense of the metrics presented by each platform. Because data visualization platforms present your data visually and intuitively, each member of your in-house teams can now access and leverage any discoveries and correlations themselves.
Not only does a proper analytics and data visibility tool prevent you from having to scramble to pull data manually and factor it out in Excel, it is also is going to give you more cohesive and granular visibility into your environments. Although a licensed platform of this quality costs upwards of $1500 a year, consider the budget percentage you spend on salary when you relegate your Accounting and IT teams into a room to “figure it out” for themselves.
There is software better adapted to analytics than your already over-worked and over-caffeinated IT staff.
Analytics Maturity Assessments Answer Questions That You Didn’t Even Know to Ask
So, you’ve decided on an analytics tool. How do you know what to look for?
Often—rather than search for positive correlations—analytics software looks for anomalies in your data in order to dig deeper for more dynamic insights. Many platforms provide customization options for what trend data you want to review through predetermined categories and hierarchies (as well as orchestration and automation settings). Depending on the industry that you’re in, you’ll want to look at your company’s metrics for:
- Quarterly overhead
- Transaction metrics
- Social media engagement
- Salary and employee optimizations
- Network inefficiencies
- Data security
- Threat detection and mitigation
The list goes on. What you are predominantly looking for, however, is trend data that relates directly to what you are trying to accomplish within your industry (e.g. We normally grow X%, based on Y, so we will want to see ____ in the next two years).
Your Answers Are Only as Good as Your Data
Data integrity is key.
Obviously, if you analyze bad data, then you will get bad answers. Bottom line, you need to ensure that you are pulling from the right data sets to surface issues and solutions that are applicable to your current paint points and end goals.
And although analytics platforms provide customizations and pre-established frameworks for your data sets, full optimization of the software requires extensive experience in the field. You may have the right analytics maturity assessment tool for the job, but you’ll need help implementing it and training your staff to continue using it in the proper way.